When playing a hand of poker (Texas holdem) the first decision you need to make as whether or not to play the blinds. This is a relatively simple decision, and the correct choice can be largely determined by the cards that you hold, and the number of opponents you are playing against. The goal of this project was to find the probability of having the strongest hand in a game of poker for a given set of hold cards (the cards you hold), and number of opponents.
Due to the incredibly large number permutations of a deck of cards, calculating these probabilities directly is highly impractical. For this reason it was decided to find them experimentally, by running a very large number of random simulations in C++. To do so each cards was modeled as a variable type with one integer to represent its suit, and another to represent its "value" (2, 3, queen, ect.). The program functioned by creating your hand, an array of the two cards you hold, and then randomly assigning the remaining cards to you opponents, and the community cards, also modeled as arrays. The program would then check for the strongest hand that each set of hole cards and community cards held, and then compare these strongest hands to find the winner. It would keep track of the number of times an given set of hole cards would win, and what combinations of cards it won with (pair, flush, full house ect.). Each of these simulations was repeated 1.5 million times per set of hole cards. It would then loop through each of the sets of hole cards to be tested and repeat this process for each of them. The data gathered was then exported as a CSV file. Such a process was repeated for different numbers of opponents to observe more trends.
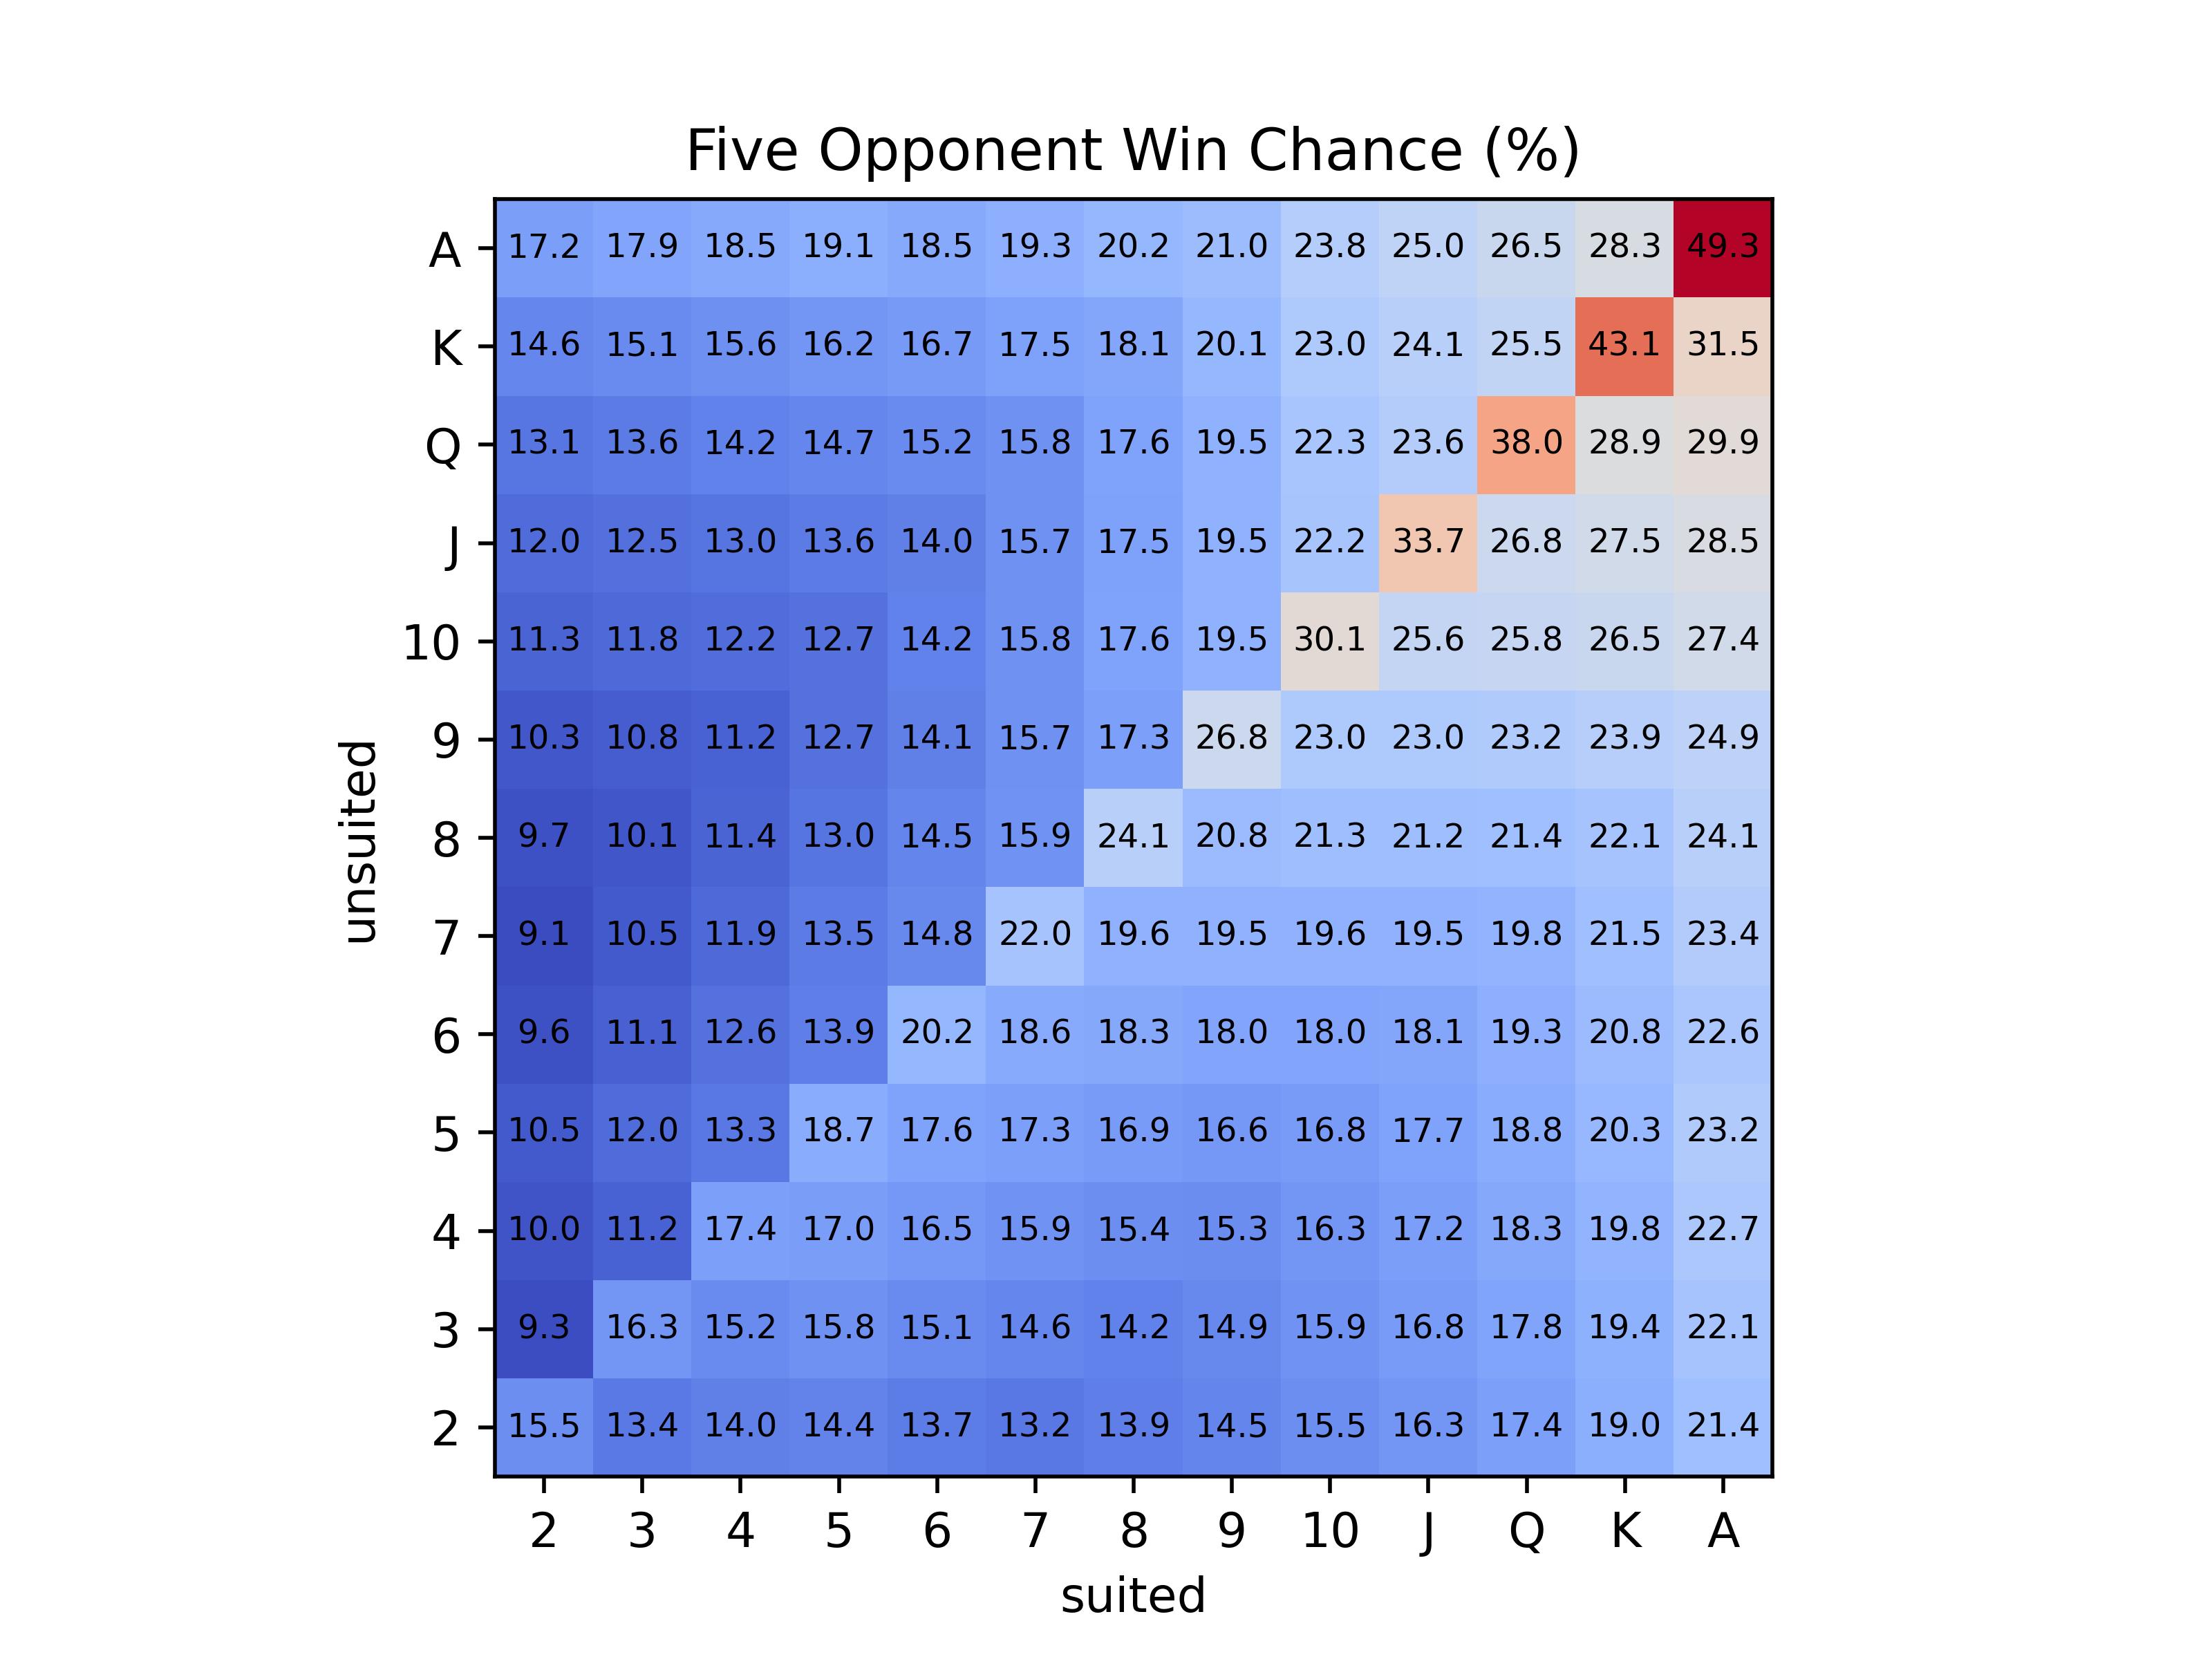
To allow for ease of interpretation of the data it was visualized with a heatmap using matplotlib and python. One of these heatmaps is pictured to the right and others can be found here . Note that to represent the winning chances of any set of hole cards we do not need to know the suits of the cards themselves, only the values of the cards and if their suits are the same as each other (suited or unsuited). This is due to the fact that in Texas holdem all suits are weighted equally, so with the same card values a flush of hearts will be exactly as strong as a flush of diamonds. This means that all of the possible hole card combinations can be represented using only 169 different cards. These cards are displayed on the heatmap with each row/column corresponding to a card value, with unsuited sets lying above the diagonal, and suited below. Note that when receiving hole cards at random there is not an equal change of your cards corresponding to each square on the graph. In general the probability of drawing a given suited hand is 2/663, that of drawing a given unsuited hand is 2/221, and that of drawing a given pocket pair is 1/221.
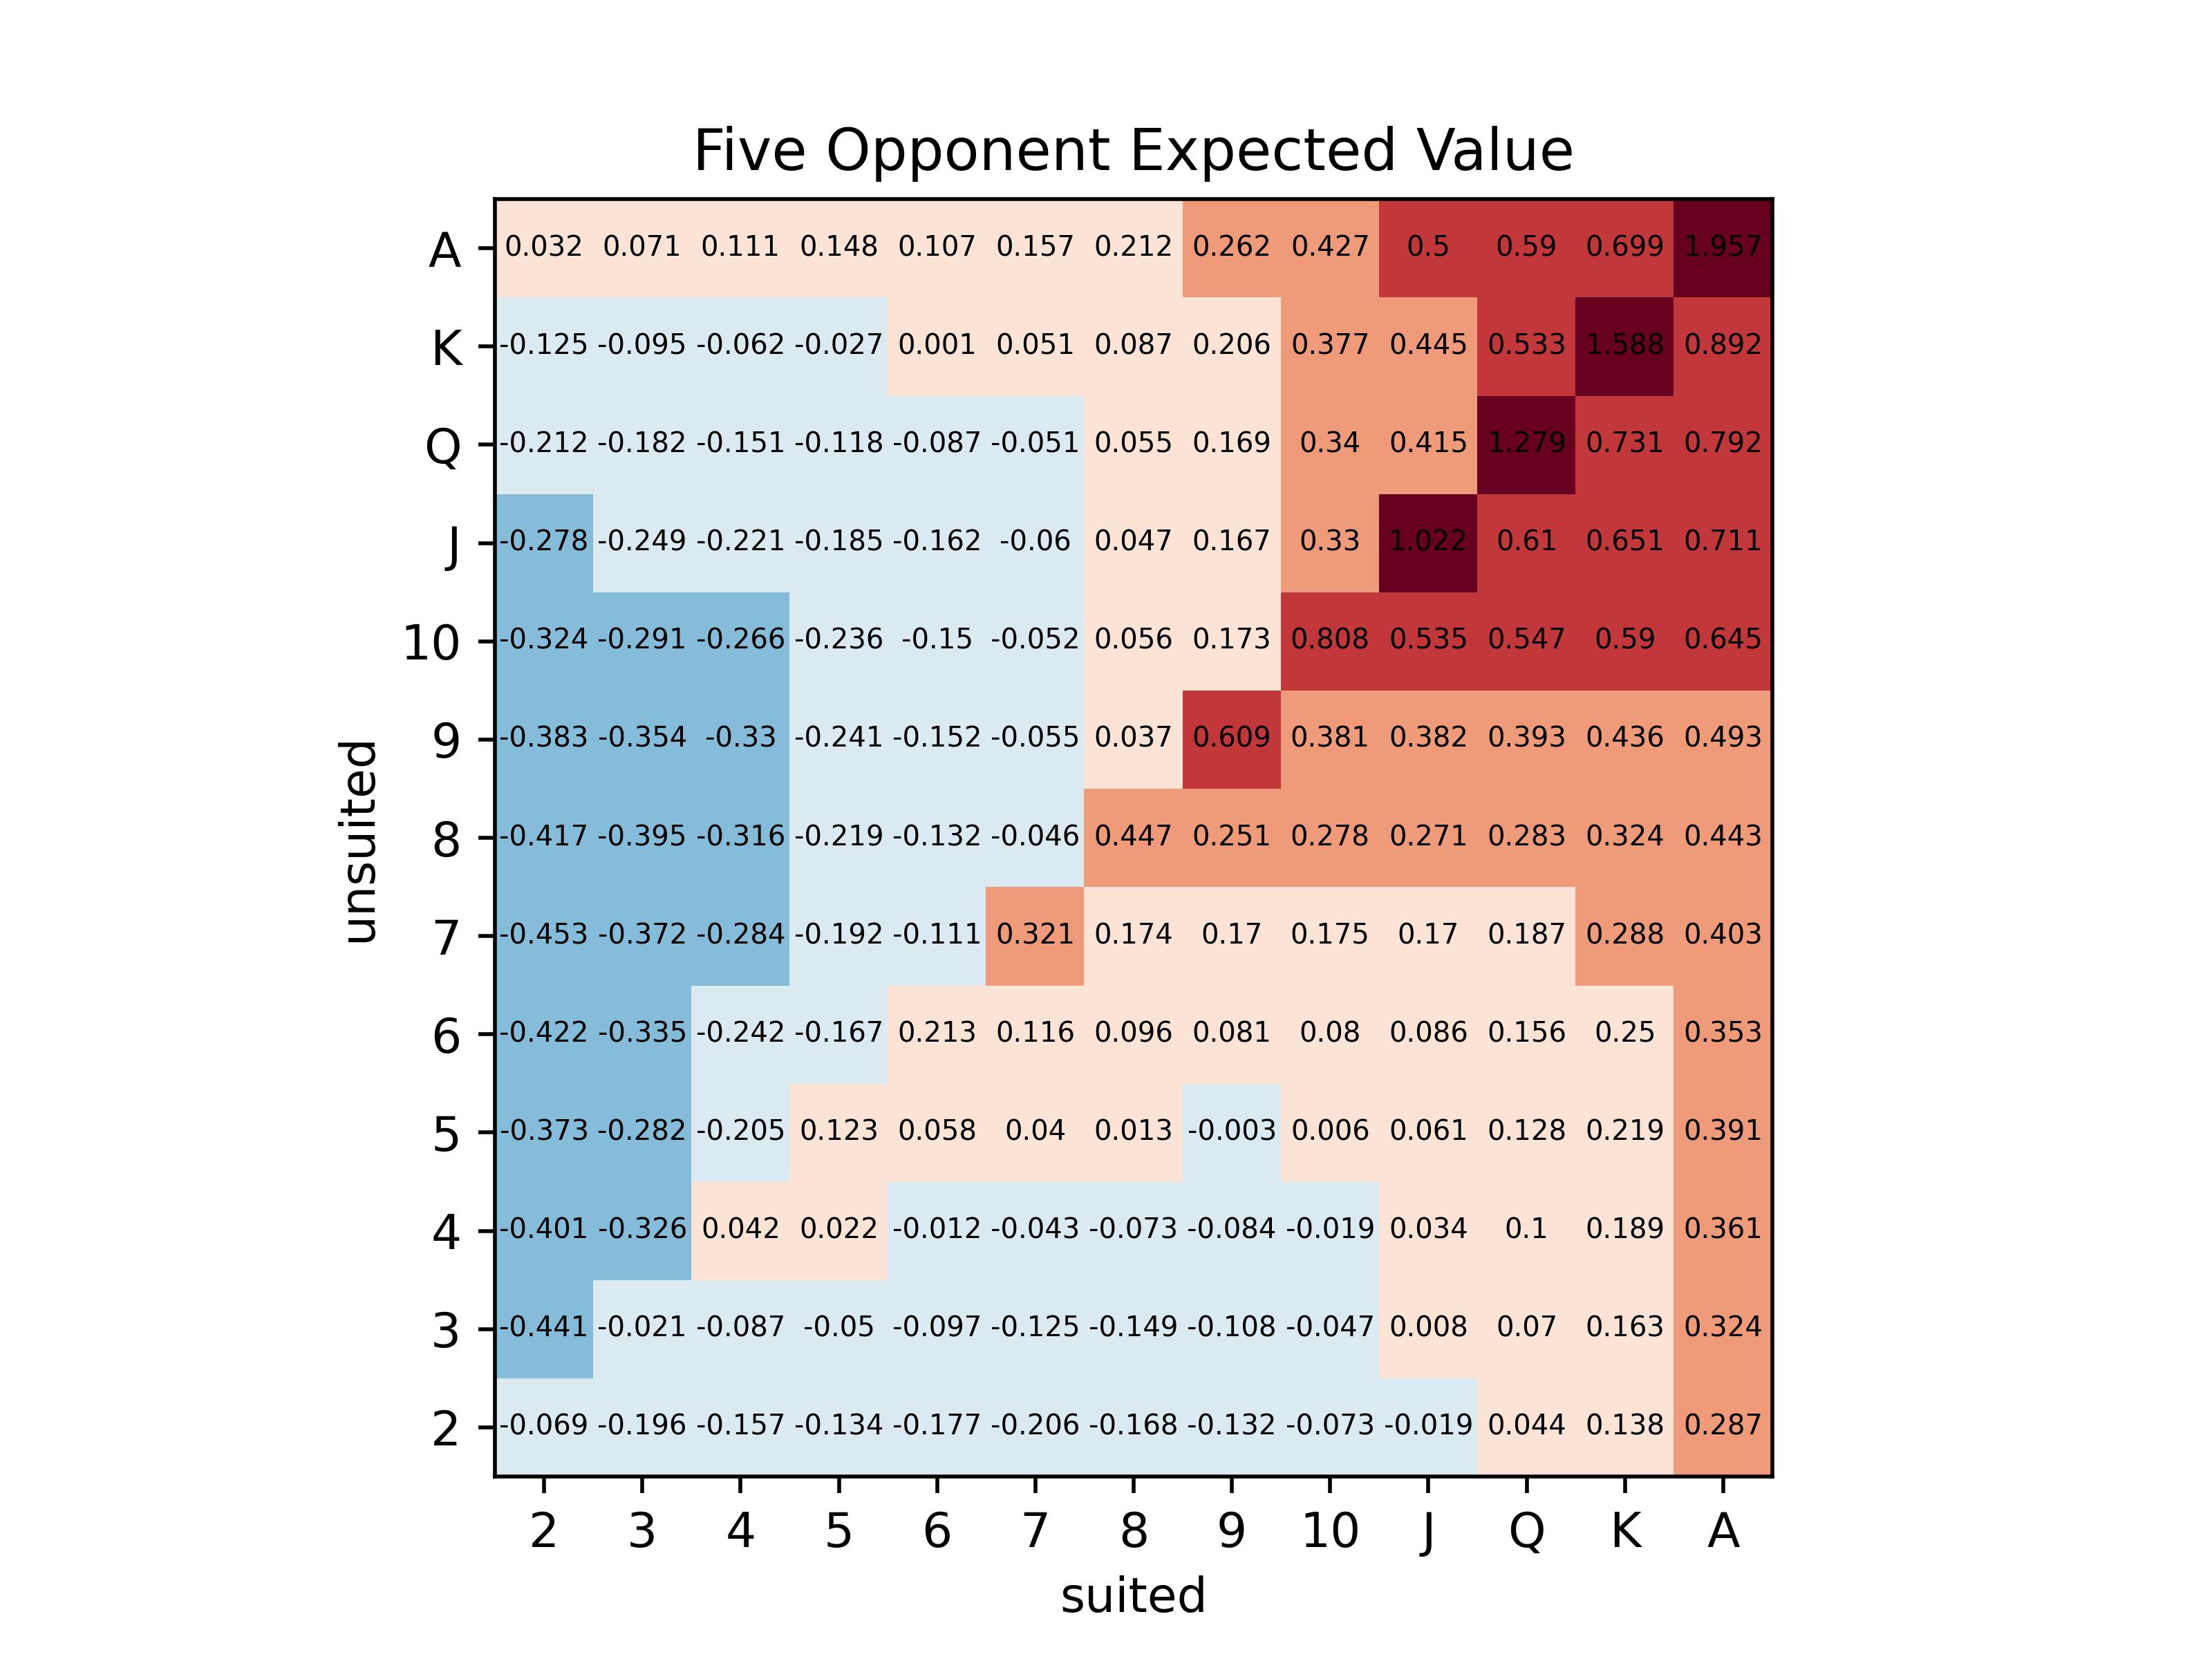
The chart shown to the right gives the chance that a given set of hole cards will have the strongest hand by the end of the game, but when actually playing poker winning chances aren't nearly as important as expected value. One way to try and quantify expected value is to assume that each player enters one "unit bet" per game, and find how much gain/loss they can expect in terms of this bet on average. This is equivalent to a game in which every player only plays the blinds each hand. Such an interpretation of the data leads to the following chart, which shows the expected value of each set of hole cards in terms of the unit bet.
This interpretation of the data however, in my opinion, doesn't very accurately capture how the game is actually played. In a game of poker, you often have a good idea of whether or not you have the strongest hand at the table before the game is actually finished, and you can raise or fold accordingly. This means that some of the hands that were assumed to have a negative expected value under the "unit bet" assumption may have a positive expected value in an actual game. Taking this concept into account is the following chart, with others available here . This chart shows the original win chance data as a number in the box, and the color of the heat map corresponds with how much you would have to expect to win from your opponents on average to have a positive expected value of playing. This interpretation assumes that each player bets one "unit bet" at the start of each game, and then the number corresponding to the colour is the quantity of unit bets you would need to win from each of your opponents on average in order to have an expected value of playing the hand. The concept here is that you can play hands with a lower chance of actually winning as long as you are confident in your ability to raise and fold appropriately in the rest of the game.
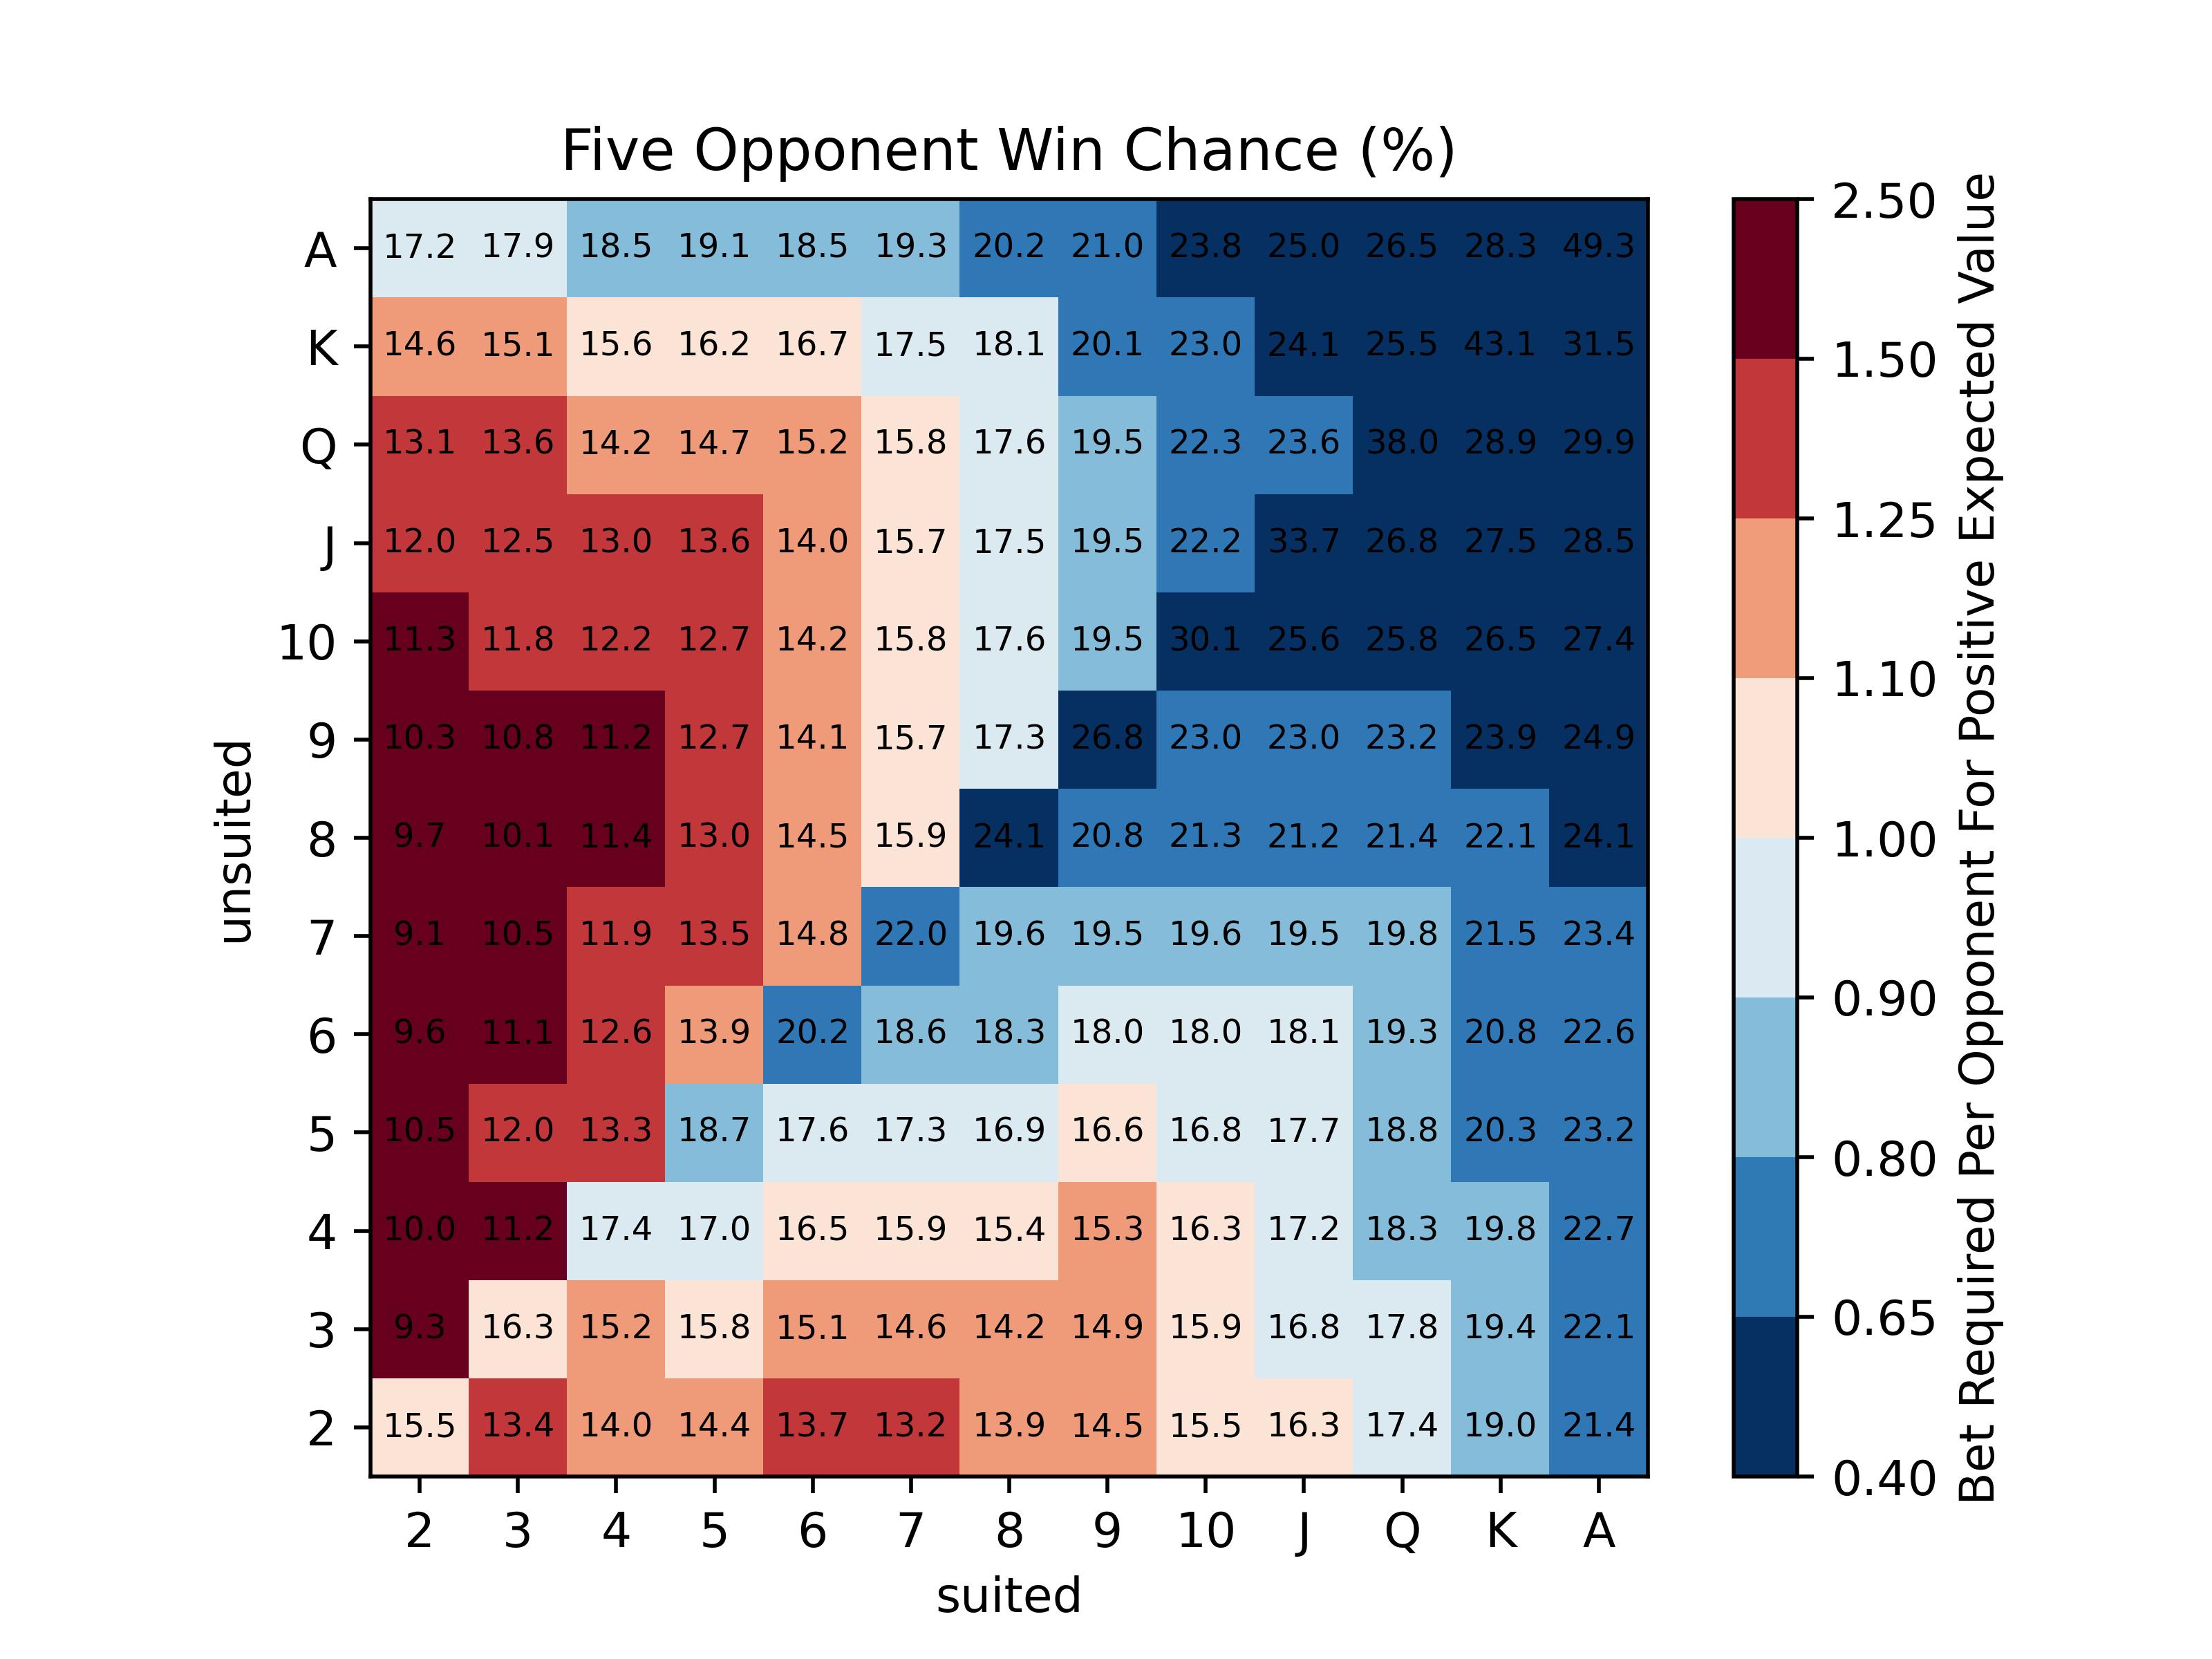
Something interesting is to observe the trends which occur as the number of opponents goes up. Notice that when there are more players having a suited hand gives you a much more significant advantage than when there are fewer. This seems to make sense because when there are less players you don't need a very good hand to win, so the increased chance of a flush that comes with suited cards isn't as significant. There are several other interesting trends, such as the expected value of pocket twos with opponent number.